Dear Clients and Friends of Insight,
Enthusiasm for the wonders of artificial intelligence continues to ripple through the economy, propelling many stocks to new highs along the way. Investors have been encouraged by the on-going company announcements of investment plans and expected gains in productivity from their artificial intelligence initiatives. During this frenzied period, you have undoubtedly heard the financial press broadcast that the S&P 500 index had reached a new high. It’s happened 29 times already in 2025! Comparably, the NASDAQ Composite index has set 29 record highs as well!
The companies that are making these AI-related announcements, which have accelerated over the summer, now span well beyond the usual technology suspects to nearly all sectors of the economy. This has reinforced investors’ expanding view of how industries and companies will likely benefit from adopting AI practices. Interestingly, Doug McMillon, Walmart’s CEO, suggested in a recent meeting with investors that every one of Walmart’s over 2 million world-wide employees will be impacted by these investments in some way or another. And now, even the Dow Jones Industrial Average (DJIA) has joined the parade, solidly moving into new-high territory throughout September. We view this widening in stock market breadth as a positive sign for our clients’ stock holdings, which have performed exceedingly well this year.
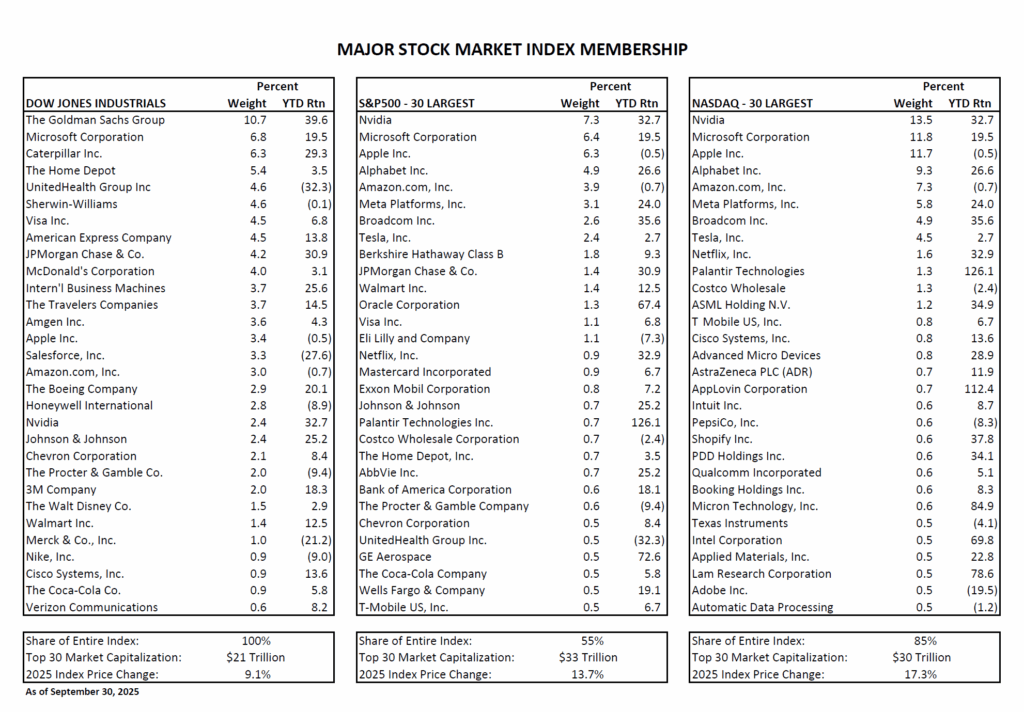
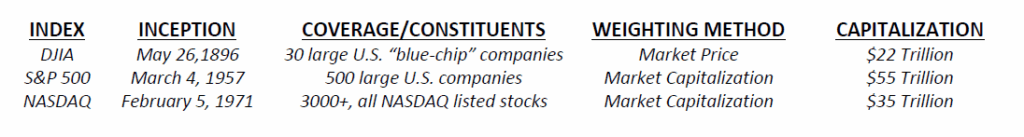
We thought it would be instructive to look closer at how these three most-commonly referenced stock indexes – the DJIA, S&P 500 and NASDAQ Composite – are constructed and what purpose they serve. The DJIA is the oldest and simplest to calculate. It includes a select group of 30 very large and well-established U.S. companies representing the bell weather of strength and breadth in the U.S economy. The constituents, which are selected by a committee, have changed over time as the U.S. economy has evolved. Each company’s weight in the index (or influence) is determined by its stock price. Simply put, a company with a $300 stock price counts three times as much as a company with a $100 stock price. Of course, this weighting method is somewhat arbitrary.
The S&P 500 is also constructed by committee and is comprised of 500 of the largest U.S. companies from all economic sectors consistent with the relative economic importance of each. As such, it is considered more representative of the broad strength and diversity of the U.S. economy. The NASDAQ Composite differs considerably from this. It is comprised of all the companies that are listed on the NASDAQ stock exchange (currently more than 3,000), which is principally populated with younger, less profitable companies within the technology and healthcare sectors.
Companies in the S&P 500 and NASDAQ indexes, contrary to the DJIA, are weighted by their stock market capitalization, which is the total value of the company’s entire public stock outstanding at its current stock price. Thus, a company with $300 billion in market capitalization will influence the index three times more than a company with $100 billion in market capitalization.
These indexes, as well as others, are useful for a variety of purposes. Originally, they were essentially used as benchmarks to measure, compare and evaluate the performance and risk of various investments over time. Now, indexes are also used to derive a vast array of commingled investment products (i.e. baskets of securities) for exposure to specific segments of the investment markets. Today these products are predominantly in the form of exchange-traded funds (ETFs), rather than traditional mutual funds. They number in the thousands and attract a growing share of investment flows. Currently, there is some $12 trillion invested across more than 4,000 U.S.-listed ETFs. Nearly $1 trillion of that was deposited by investors this year alone!
Back to our featured indexes. They each have corresponding ETFs designed to give investors easy access to the respective risk and return results of the index. For example, one could invest in the SPDR DJIA ETF (symbol DIA) for exposure to the DJIA, the SPDR S&P 500 ETF (SPY) for exposure to the S&P 500, and the Fidelity Nasdaq Composite ETF (ONEQ) for NASDAQ exposure. Many investors who seek diversification will invest in several different ETFs aimed at different market segments. However, since each index, and by default each ETF, has its own construction methodology these investors need to be mindful of the composition of the ETF’s underlying securities in order to achieve their intended result.
For instance, if one invested $1 million into each of the above-referenced ETFs (DIA, SPY and ONEQ) they would have $3 million invested across primarily 64 companies. However, 18 of them have significant weights in two of the ETFs while four companies have significant weights in all three. Importantly, this investor would own approximately $300,000 in each of the three largest holdings (Apple, Microsoft and Nvidia), or 30% of their total portfolio. For more information, please refer to the enclosure with some details about the 30 largest constituents of each index.
Our portfolio construction methods are mindful of these risks. Although we pay close attention to the various indexes and investment options available, our investment decisions are based on the merits of each company. We typically invest in about 50 stocks with roughly equal amounts allocated to each. Over time these allocations shift with changing stock prices and as we trim or add to positions based on each company’s operating results. These results have generally been quite positive lately and we remain optimistic about their future. We believe our current position is appropriate for meeting our clients’ conservative goals of preserving capital while providing reasonable growth in principal and income. We look forward to our future discussions with each of you.