Dear Clients and Friends of Insight,
Investors’ risk and return objectives vary greatly. To meet most appropriately this wide range of expected outcomes, they invest around the world across a wide range of financial and physical assets. Despite the many differences in portfolio composition and eventual results, investors share a common challenge. They all must make their investment decisions facing uncertainty.
Often these decisions seem straightforward, usually it is when the future appears clear and feels comfortable. Other times, when the future seems quite foggy and feels dangerous, these decisions weigh more heavily on investors. Lately, it feels a bit heavy. The obvious uncertainties continue to grow while the flow of information to investors has been confusing to interpret and to choose an appropriate response.
A prime example of the current concerns is the economic uncertainty that comes from returning to easier global monetary policies after several years of tighter global monetary policies. The Federal Reserve, along with many other central banks, recently lowered short-term interest rates, yet yields for longer-term bonds rose. The labor market reports have shown positive employment growth and unemployment claims have fallen for four straight months, yet the unemployment rate has risen. Expectations for future inflation continue to fall, yet this year’s economic growth rates have been revised upward, and most recently stand at 3%. This is quite strong by historical standards.
Here are just a few other uncertainties to consider. How will the economy be impacted by the tremendous private and public investments in technology, infrastructure and energy? Will these investments improve productivity and have profitable outcomes? Can energy prices remain low or continue to fall even though global political and economic challenges continue to escalate? Is China’s economy in long-term decline, or can China reclaim some of their global dominance?
What impact might this have on global markets?
Even with many compelling questions, lately clients have been asking us more often about the upcoming elections and what impact we should expect once the results are in. Naturally, this uncertainty becomes top-of-mind every Presidential cycle, and for many global investors this year’s election is weighing on their thinking even more heavily than usual.
Let’s look at the historical market return data since 1945 for a guide. Over these last 80 years, through good times and bad, the S&P 500 posted average annual returns of 9.1%. During Democrat Presidencies the average was 11.5%, besting the 7.1% posted during Republican Presidencies. On the surface, this may seem counterintuitive. If we look at this history with greater detail, we find that there is more to the story than which party holds the Presidency. Annual returns have varied greatly and tell a mixed story depending on which party controlled Congress, and whether that control was unified or divided with the Presidency.
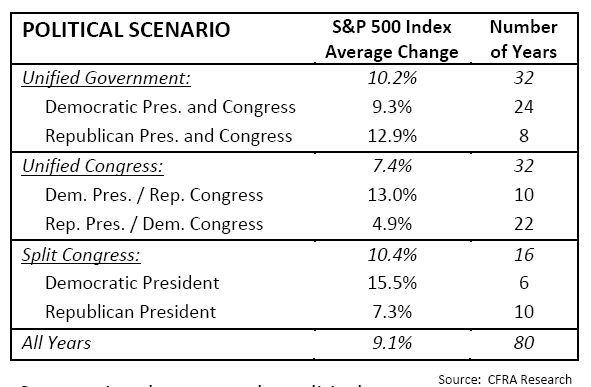
With these political scenarios in mind, we share the nearby table which shows the historical average yearly returns for the S&P 500 under the variety of election outcomes. Starting with the 32 years of unified government, we find a different result. Although the average stock return of 10.2% was slightly better than the 80-year average, when government was controlled by Democrats, the average fell to 9.3%. Conversely, when government was controlled by Republicans stocks rose 12.9%. If we drill down to consider the composition of Congress we find more telling results. For all 32 years with a unified Congress and a divided Presidency, the average return dropped to only 7.4%. Yet when we segment these periods by political party, we find even greater differences. The S&P 500’s average return with a Republican Congress was a healthy 13.0% but fell to only 4.9% while controlled by Democrats. Turning now to the 16 years marked by a split Congress we found the average return was 10.4%, again slightly better than the 80-year average. Segmenting these years by political party showed an extraordinarily strong average gain of 15.5% when a Democratic was President, while posting a modest 7.3% gain while a Republican was President.
Although these findings may be interesting for many investors, we are always cautious about making investment decisions based on historical studies such as these. In this case, the sample size is small, especially after we segment the years, and the study provides only a numerical summary for each period. It does not help lighten the weight of uncertainty caused by the range of future concerns investors face today. More helpful would be an analysis of the political and economic situations of the times, and how policy decisions may have influenced stock returns and why. Those studies exist, but, of course, the conclusions are debatable.
We believe the best way to lighten the weight of uncertainty is to adhere to an investment strategy such as ours. It is designed to preserve a portfolio’s value during challenging times, yet also provides the portfolio an opportunity to profit during good times. We continue to exercise caution with our investment decisions while always focusing on the appropriate long-term risk and return outcome for each client.
Here is an important milestone I would like to share. In August, Insight celebrated our tenth year as an independent, registered investment advisor. We are grateful for the support, confidence, and referrals from our clients and friends over these many years. I would like to especially thank my colleagues at Insight. Their contributions to delivering outstanding investment results and superior service for our clients have been tremendous.