For many years now the growth and profitability of large U.S. companies has been exceptional, especially when compared to other countries around the world. Global investors have noticed as they have continued to invest large sums of capital in U.S. stocks, helping to propel many of these stocks to all-time highs. Although virtually all stock market indexes moved higher over the last two years, Large-cap U.S. stocks outperformed other indexes by a large margin making up for their losses from 2022.
By example, the S&P 500, which is the best representation of large U.S. companies has returned 58% over this period! By comparison, Small-cap U.S. companies have returned 26%, International Developed markets have returned 23% while Emerging Markets are up only 18%. This is a testament to the diversified and durable U.S. economy, the leadership positions our companies have earned around the globe, and their financial flexibility to continually invest in their future growth and profitability. Some investors believe that these strengths can lead to a boom in productivity and a continuation of these trends.
Here are a few interesting observations which further describe these trends in the popularity of U.S. Large-cap stocks:
- The S&P 500 added $11.4 trillion in market value in 2024. This is greater than the combined market value of the Eurozone, Switzerland and Australia.
- The largest 10% of stocks represent 75% of all the stocks that trade on U.S. stock exchanges, an all-time high. In 1985, they represented less than 50%.
- The number of publicly traded stocks on U.S. stock exchanges is approximately 3,700 while just 25 years ago there were 7,200 stocks traded. Smaller public companies have consolidated or have been acquired and private companies have delayed their public offerings until they have become more mature.
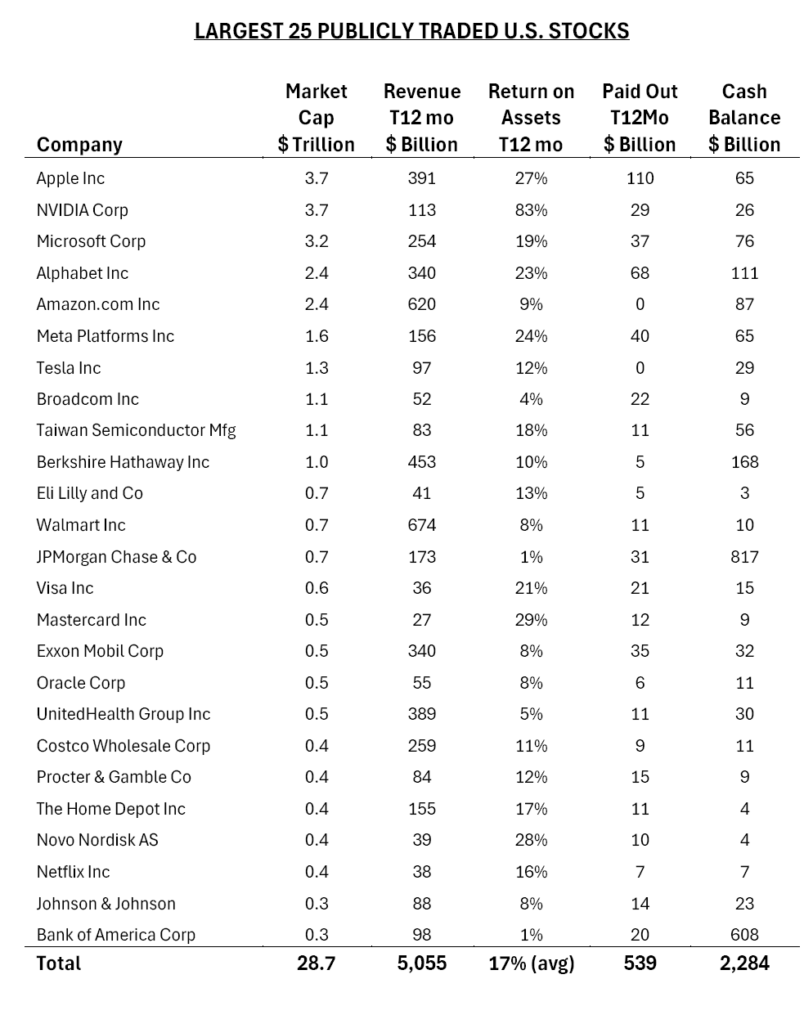
Let us drill down further among the U.S. Large-cap category and focus on just the largest ones. On the following page we provide a table with the 25 largest stocks that are publicly traded on U.S. exchanges, as measured by their Market Capitalization. Apple, for example, is the largest at $3.7 trillion! In addition to the company’s size, the table displays their trailing 12 months (T12 mo) of Revenue, Return on Assets, the total amount each company Paid-Out to its shareholders in dividends and share repurchases, and the current Cash Balance. These are impressive numbers. Insight had an exceptional year as well. Importantly, our client portfolios advanced quite nicely in 2024 due to the robust performance of both our stock and bond holdings. This is especially rewarding when considering our conservative focus on preserving our clients’ capital and growing their income. Many of the stocks in Insight’s client portfolios are well-represented among this list. Notably, our business grew tremendously as well! I am pleased to report that we are now responsible for managing $235 million in client assets.
The entire Insight team thanks you for your continued confidence in our investment counsel, and we wish you a healthy and happy 2025.


