Dear Clients and Friends of Insight,
We are very pleased to see the recent price moves of many of our current portfolio holdings. Other investors have recognized the quality, value and growth potential of these businesses and as a result, our clients’ portfolios are performing very nicely this year, both in absolute terms and relative to appropriate benchmarks. Of course, it also helps that the U.S. stock market is trading at all-time highs. This year’s market advance has been in response to materially positive trends in our economy, which we had been expecting. The key mainstays to this include strong and steady GDP growth, rapidly growing corporate earnings, modest interest rate levels, tame inflation, and a more business-friendly regulatory culture.
Yet, stock gains have not been uniform. Some stocks are performing incredibly well, while others are struggling to retain investor interest. As is common, market leadership tends to rotate over time as different themes influence investors’ buy and sell decisions. The greater these influences are, the greater the potential disparity between the price movements of individual stocks.
Consequently, actual returns achieved by investors can be quite different than the reported performance of the popular benchmarks, such as the Dow, S&P 500 or Nasdaq. This disparity stems from how dissimilar a portfolio is to the benchmark’s various constituent companies and their respective weightings. An extreme example of this is when many investors owned large concentrations of internet stocks just prior to the dot-com bust in the early 2000’s.
A common way for our industry and academia to evaluate these broad influences on investor preferences and their impact on investment returns is to compare the various company characteristics of the market’s leaders to its laggards. Our industry calls these characteristics “risk factors”. Examples of these characteristics are a company’s size, economic sector, expected growth rate, variability in earnings, and dividend yield, to name a few. Thus, investment style indexes were created which further group together the companies within the index that tend to have similar characteristics. The most customary of these are growth and value style indexes.
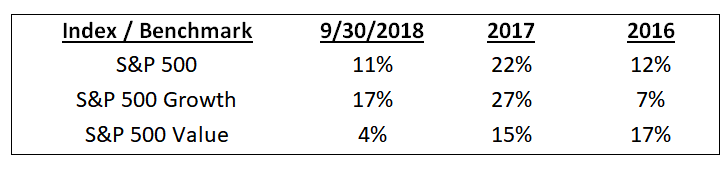
Let’s understand the disparity of our current market by focusing on the S&P 500. It is very possible that, if an investor’s portfolio differed much from that of the S&P 500, its performance diverged from the “market’s” return by plus or minus 10%! This is evident when we look further into the make-up of the S&P 500’s recent returns. Here we show these returns for the S&P 500 and its Growth and Value style components.
Growth and value style indexes do a fairly good job of capturing some of the broad differences in investor preferences. Here is a simple description of each style.
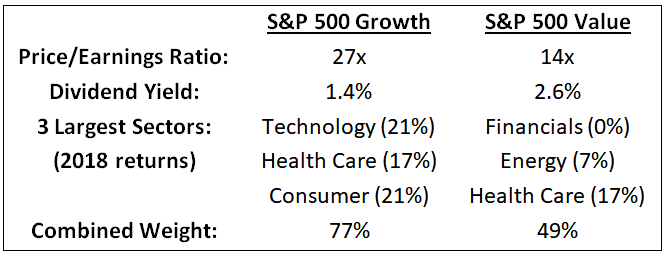
Growth investors buy stocks that are expected to grow rapidly, and which pay little or no dividends. These companies tend to sell for high prices relative to the company’s underlying business metrics such as earnings, sales and book value. Growth stocks usually exhibit wider price swings and are considered riskier.
Growth portfolios can be concentrated in new industries and unproven companies.
Value investors buy stocks that sell at low prices relative to the company’s underlying business metrics. These companies tend to have modest growth
expectations, but they pay meaningful dividends. Value stocks usually exhibit milder price swings and are considered less risky. Value portfolios will usually have greater exposure to the nuts-and- bolts of the economy.
At Insight, we seek to own growth companies, yet we lean more toward the value style because we are very conscious of the price we pay for each investment. We usually invest in industry leaders. They are financially strong and earn healthy profits. We believe they are likely to demonstrate better-than-average growth in sales, earnings, and dividends. Our goal is to invest in these businesses for the long-run. As we manage portfolios we employ conservative and proven standards. This discipline often results in a portfolio that is dissimilar to the S&P 500.
In closing, we offer brief comments on the current market environment and our portfolio positioning. We believe that, while interest rates may drift higher, they will remain lower than the rates that prevailed for most of our current history. This setting should support continued economic expansion. Corporate earnings should continue to grow, which would allow for continued market gains. The market’s valuation remains modestly above average, yet we are still finding new opportunities. Valuations could even expand again as uncertainty arising from recent negative news flow abates. Concerns regarding trade wars, emerging economies, rising inflation and the upcoming mid-term elections, could also cause uncertainty to spike, leading to short-term market corrections.
Within portfolios, we have been selectively realizing gains to maintain each client’s appropriate exposure to equities, while being very sensitive to tax liabilities where appropriate. We think our current holdings, including many of this year’s winners, still represent good value, and generally pay very healthy dividends. For now, we remain positive and look forward to when more of our holdings are recognized by other investors for the quality, value and growth potential of their underlying businesses.
INSIGHT INVESTMENT COUNSEL