Dear Clients and Friends of Insight,
October 2017 marks the ten-year anniversary of the end of the prior bull market, which foreshadowed numerous company failures, the Great Recession, and the pricing collapse of nearly every asset around the world. Major stock markets declined for well over a year, bottoming in early 2009 after losing more than 50% of their value. Since then, the market has retraced its lost ground to finally surpass its previous high in March 2013, and it has proceeded to climb ever higher since. Throughout this climb, many investors were skeptical that this bull market could continue advancing, but it has proven them wrong. So far, this market has advanced some 270% from the lows of 2009, as measured by the S&P 500, and is the second longest one on record.
This, of course, leads serious, risk-minded investors to question how much higher the market might go, and how soon the next bear market might strike. As we’ve discussed in previous letters, the market is richly valued and the world has plenty of uncertainty. Yet there is truth in the saying that bull markets do not die of old age or high valuations.
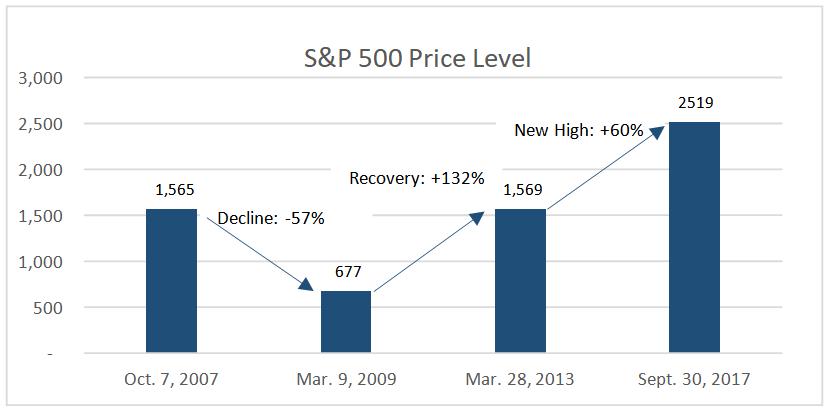
Let’s take a closer look at what’s happened over these last ten years by breaking the entire period into three segments: from peak to trough (we will call “Decline: -57%”), from trough back to prior peak (we will call “Recovery: +132%”), and from recovery to today (we will call “New High: +60%”). A careful review of the accompanying chart shows that the return for the entire period from the prior peak in 2007 to now has also been 60%. That equates to less than 5% per year! Hardly what you would expect from a raging bull market and well below long-run averages.
The main reason that this market has underperformed its long-run average is that our economic recovery has been by far the slowest for the post-WWII period. It should not surprise us that inflation and interest rates have remained low and stable during this period of slow growth, which many are now calling the “lower for longer” economy.
Looking forward, global economies are growing in unison for the first time in years, corporate earnings have grown at double-digit rates this year, and are likely to continue their upward path.
Importantly, inflation and interest rates should remain somewhat predictable and low by historical standards. These are indicators of continued growth rather than of an imminent recession from which nearly all bear markets arise.
Interestingly, the last time we experienced this degree of synchronization of global macro- economic conditions was throughout the 1990s. The U.S. economy was referred to back then as the “Goldilocks” economy for being not-too-cold and not-too-hot. It provided the backdrop for unprecedented market appreciation with very little interruption. The bull market from December 1987 through March 2000 gained 582%, and lasted 12 years!
Though we do not think the next bear market is around the corner, risk is elevated and some meaningful corrections should be expected. The market has not endured a correction since early 2016, which is uncommon. Corrections can be sparked by any number of unanticipated reasons and can cause investors considerable short-term pain. We are reminded of another October anniversary: October 19, 1987, referred to as Black Monday, when major market indexes declined more than 23% in one day!
It is important to remember that, in the long-run, the most successful investors do not time the market, moving in and out of stocks in anticipation of major market moves, but rather they are the ones whose carefully chosen investments preserve more value through the inevitable market declines. As the previous graph shows, the S&P 500 needed to advance 132% to just recover the value lost from its 57% decline. One of the proven ways to preserve a portfolio’s value during a difficult market is to selectively invest in the stocks of high-quality, financially sound businesses that have demonstrated growth in both sales and earnings, have delivered strong returns on equity and assets, pay meaningful dividends, and which are purchased at reasonable prices. It is not by accident that the stocks in our client portfolios have the following attributes:
| Debt-to- Equity | 5-year Est. EPS Growth | Return on Assets | Dividend Yield | Forward P/E Ratio | |
| Insight portfolios | 32% | 10.8% | 6.9% | 2.3% | 15.6x |
| S&P 500 | 86% | 9.7% | 7.6% | 1.8% | 20.5x |
*Source: Yardeni Research, Morningstar
For those of us who have practiced this profession throughout four decades, these October anniversaries are a continual reminder of the importance of exercising a disciplined investment process that is guided by contrarian thought and common sense.
INSIGHT INVESTMENT COUNSEL