Dear Clients and Friends of Insight,
That was quite a good year… for our economy. Economic growth easily and consistently exceeded 3%, after trending nearer to 2% for most of this long expansion. Corporations were extremely profitable and delivered on robust growth expectations. Employment continued to grow nicely.
Incomes rose while inflation remained low. Consumers spent freely, especially this holiday season, without adding to household debt. This sounds like a winning script for strong stock returns. Yet, that is not how this story played out.
As good as 2018 was for the underlying economic fundamentals, the fourth quarter turned into chaos for the stock market. The S&P 500 Index, for example, came crashing down 19.8% in a quick 95 days from its high in late September to its low on Christmas Eve. What was shaping up to be a rewarding year for U.S. stock investors instead goes down as a negative one, and potentially, a turning point for this long bull market.
What changed? As the year wound down, “what is” great news became “what was” great news, and investors shifted their focus to “what next” and then, “what if”. With uncertainty growing, investors have been discounting positive indicators, and instead worrying overwhelmingly about negative outcomes. What if the Fed’s policy decisions hasten the inevitable recession? Or, our trade disputes intensify? Or, international economies continue slowing? Or, credit conditions deteriorate? And, what if this is the early stage of a major bear market that could last well into the future and erase a large percentage of our assets?
Now, stocks are on sale but there are few buyers. Many market participants are waiting on the sidelines until the fog clears, while the algorithmic-index traders continue to fuel the volatility. Fear is outweighing greed, and it takes courage to catch a falling knife. Returns for holding cash are more meaningful now that interest rates are higher, so investors can more patiently decide whether the worst of this correction is behind us, or whether there is considerably more to come.
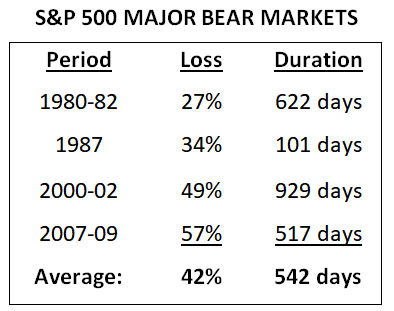
Let’s review the recent history of significant market declines to gauge the severity of our current situation and what we might expect for the market in 2019. Since 1980, there have been eight such market declines. Four of them are considered major bear markets that lasted many months and ended with severe losses. As you can see from this table, these bear markets, on average, lasted 542 days and eroded 42% of the market’s value. In order to understand each bear market, it is important to recognize each period’s economic backdrop. Except for 1987, these markets were characterized by challenging economic conditions that required prolonged resolutions.
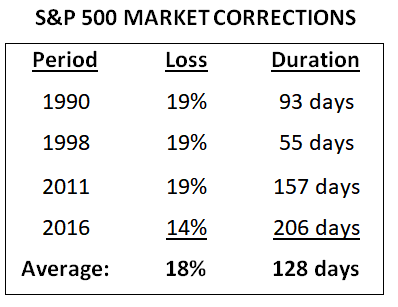
As for the remaining four declines, they were all substantially less severe, and as such, are considered market corrections. As you can see, the pain was much more tolerable, with the S&P 500 Index, on average, falling 18% over 128 days, similar
to our current decline. For each of these periods, the economy was generally strong before the market contracted, yet some unexpected global economic issue triggered the decline. When investors determined that the issue was more transitional than permanent, the bull market charged ahead.
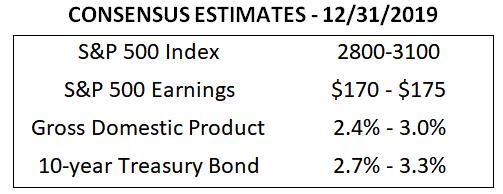
What to do now? Bull markets require three ingredients: positive economic fundamentals, justifiable stock valuations, and investors with composed sentiment. Our recent letters have routinely discussed this economy’s positive fundamentals, which we believe will mostly continue. Growth is slowing to more sustainable levels following the tax cuts, but there are few signs of an impending recession. Here we show the current consensus estimates for major indicators at year-end 2019. We believe investor sentiment will improve.
We see the potential for positive fundamental news outweighing the potential for negative fundamental surprises, and this should lead to more composed market participation.
What about stock valuations? Earlier in 2018 when investors were less fearful, the S&P 500 Index was trading for 18x expected earnings. Historically, price-to-earnings ratios have ranged between 12x – 18x, though extreme investor sentiment has steered stock prices to occasionally trade at much higher and lower valuations. Now, due to this correction, the S&P 500 Index is selling for less than 14x expected earnings. This level is quite moderate, and consistent with our thoughts in our April letter, after the market’s first quarter pullback. It discussed the market’s potential downside if investor sentiment continued to worsen, which is what has occurred now.
The stock market can behave in unpredictable and cruel ways. Though fundamentals look good and valuations are reasonable, investor sentiment can overwhelm rationality. That said, major bear markets do not occur without recessions, and we believe the last leg of this economic cycle has yet to arrive. Remember, bull markets climb a wall of worry. Our goal is to help clients understand and focus on the most essential and longer-term factors affecting their stock investments. If we have accomplished this goal, we’ve helped clients worry a lot less about the emotionally-driven, shorter-term market moves—however large they are—caused by “what ifs?”.
Wishing you a healthy and happy 2019!
INSIGHT INVESTMENT COUNSEL