Dear Clients and Friends of Insight,
Throughout the first half of 2024, the major stock indexes continued their ascent to set records late in the second quarter. Our clients’ portfolios are performing quite well this year, and we are pleased that their strong results are well above their long-term objectives. Not all investors can say the same. If they were among the underperforming crowd, it was highly likely that their portfolios had insufficient investments in the best performing sectors of Technology (up 28%) and Communication Services (up 27%). Both were boosted by the enthusiasm around generative artificial intelligence. We have meaningful investments in these sectors, which has benefited client portfolios.
Additionally, many investors underperformed their long-term objective because they had a lower exposure to stocks relative to their long-term target, based on their risk and return objectives. Generally, these investors have been fearful of the future and have intentionally shied away from the risk of stock ownership. We have embraced the value of stock ownership, which has benefited client portfolios.
These fears revolve around a combination of issues which most prominently include: a precarious economic backdrop, an unstable geopolitical environment, rich stock valuations and an uncertain election season. They are understandable concerns, though many other investors continue to see opportunity ahead. Thus, there continues to be considerable disagreement among market participants about a wide range of issues that can influence the future direction of stock prices. Recall our letter from January when we reviewed the 2024 year-end price forecasts for the S&P 500 Index from a wide sampling of Wall Street strategists. At the time most experts expected very modest or negative returns for this year. So far most have been wrong. We commented: “Undoubtedly, each of these experts will change their stories as the year unfolds. We’ll find out this coming December which one of them was closest to the mark.”
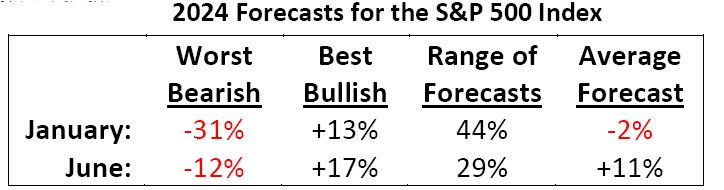
Though there are six months left in the year, we thought you would appreciate an update on what the strategists are thinking now, which we present in the nearby table. I have two observations to point out. First, forecasts for the year’s returns from almost all strategists have risen. Thus, the average forecast for the year’s return has moved up from a loss of 2% to a gain of 11% – a significant increase of 13%. Not coincidentally, the S&P 500 Index has already advanced 14% this year. It seems apparent that the experts have just bumped up their guesses by virtually the same amount. Some experts they are! Secondly, the range between the worst bearish case and the best bullish case has narrowed considerably from 44% to 29%. This is not surprising because the market’s trend has been up and the forecast period is now only 6 months away.
This rise in investor confidence for stocks and the narrowing of their forecasts warns us to be cautious. The stock market has a reputation of proving the consensus wrong, and at today’s high prices there seems to be a greater likelihood of a short-term set back than a continuation of record highs. Let’s revisit the behavior of the stock market during the post-pandemic economy to see what lessons we can learn. Recall that once the economy reopened, with the help from extensive global government stimulus, it roared, and so did stock prices. Stocks set new highs in 2021. Then, as inflation and interest rates inevitably roared too, the serious bear market of 2022 arrived, and
stock prices plunged until late that year before beginning their recovery. And now we have reached new highs again.
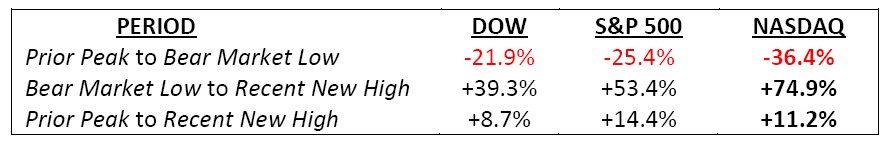
Though it was not long ago, many investors have forgotten what that experience felt like. In this table we show the percentage price change for three distinct periods for the three major U.S. stock indexes. Of these three indexes, the Dow Jones Industrial Average (DOW) represents more mature companies, the NASDAQ represents more faster growing companies while the S&P 500 Index represents the broad U.S. economy. Regarding the periods, the first is from the prior peak of late 2021 down to the bear market low of late 2022. The next is for the bear market low of late 2022 up to the recent new high. Finally, we show the cumulative change for the entire period from prior peak to the recent new high in 2024. Combined, it is about 2 ½ years. Notice that the Nasdaq’s price change from its bear market low to its recent new high is an amazing 74.9%. But because it followed a decline of over 36% from its prior peak, the cumulative price gain has only been 11.2% for the 2 ½ years. This is not an acceptable return for the level of risk incurred.
As the table demonstrates, stock prices have swung widely for investors of all stripes. Investors with a higher risk appetite experienced wider price swings than more conservative investors did, yet the cumulative results did not differ significantly between each investor-type. For all of us it has felt like a roller coaster ride. Though we are more cautious today than earlier in the year, our long-term view for stocks remains positive and our short-term view for bonds remains cautious. We believe that our collective experience, contrarian judgement and disciplined decision-making process provides sound guardrails for preserving our clients’ portfolio values in these uncertain times. Thank you for your continued confidence in our guidance. Belatedly, Happy 4ᵗʰ of July. We have much to celebrate!